TOMS, of course, is an accessory company that markets itself like a charity: When you buy TOMS products, the company makes an in-kind donation to a person in need. When someone buys a pair of TOMS shoes in the US, for instance, the company donates a pair of shoes to a child in a poor country like Haiti.
....
But the truth is that while that kind of messaging is evidently a great way to sell trendy shoes, or to otherwise raise money, it’s not a very good way to do charity. At best, it’s inefficient: It focuses on programs that waste your hard-earned cash by failing to do the most good per dollar. At worst, it promotes a view of the world's poor as helpless, ineffective people passively waiting for trinkets from shoe-buying Americans. While the shoes themselves probably won't lead to any kind of disaster, that worldview can lead to bad policies and real, serious harm.
....
On the surface, this idea makes sense. Shoes seem important! They protect your feet and are a basic requirement for participation in a lot of public life. Not having them sure sounds like a big problem. Getting free shoes sure sounds like a great solution.
....
It might be easy to miss, but there are two really big logical leaps in the story that products like TOMS tell you: that the hardships the poor kids were facing were due to their lack of shoes, and that giving them shoes was therefore the best way to address those problems. Neither of these, unfortunately, is correct.
When TOMS worked with an outside research team to evaluate the impact of its shoe donations, the researchers were unable to find a way in which the shoes had much of a substantive impact on poor kids' lives. The kids liked the shoes, and used them to play outside a little more often. But there was no significant improvement in their school attendance or self-esteem.
In fact, the data suggested that receiving the shoes caused the children to spend a bit less time on homework. (Perhaps because they were too busy playing outside?) It also made the children slightly more likely to feel dependent on outside aid — a learned dependency that can be damaging.
....
There’s a different approach. Instead of giving shoes, why not give poor people cash? If shoes are really what the recipients need, then they can go ahead and buy them. But if not, their options are wide open: They can put the money toward medicine or a crop loan or school fees. Or they can use it to invest in some kind of income-generating venture, such as livestock or a small business.
If you’re like most people, you’re probably feeling some discomfort with that idea. If you give shoes to a kid, then at least you know the kid has shoes. But if you give money, what’s to stop it from being wasted?
The message of TOMS-style giving is that it’s fine for you to make the decision about what the recipient needs, because you (and by extension, TOMS) are smart and know what’s best. That’s an appealing message, because it carries all kinds of really flattering implications about how clever and responsible you are, and it puts you in control. But research very strongly suggests that in addition to being condescending, it’s a bad way to run an aid program.
Take, for instance, a recent study by Columbia political science professor Chris Blattman. He and his team ran an experiment that gave poor women in northern Uganda cash to start small businesses. One group got cash plus expert advice on starting a business, but a comparison group got cash alone. After a year, both groups were doing better.
Part of the point of the experiment was to see if the benefits of the expert advice outweighed the costs of bringing them on. It did not: Over the period that the study measured, the program would have achieved a greater impact if it had skipped the experts and handed out the extra cash to recipients. Likewise, the charity GiveDirectly has seen very positive — and efficient — results from its programs of directly sending cash.
TOMS hasn’t run a similar study comparing its own programs with cash. But there’s at least some evidence that recipients of TOMS shoes really want money instead: the many anecdotal reports of TOMS turning up in markets in the countries where they’re donated. Those TOMS recipients are turning the shoe-donation program into a cash-donation program on their own — just a really inefficient one, in which the costs of developing and delivering the shoes are essentially wasted.
Friday, July 31, 2015
Buying TOMS shoes is a terrible way to help poor people - Vox
Buying TOMS shoes is a terrible way to help poor people - Vox
Dead and Registered: Clarke County, MS, Sued for Having More Voters Than Live Citizens | PJ Media
Dead and Registered: Clarke County, MS, Sued for Having More Voters Than Live Citizens | PJ Media
Being dead may not necessarily disqualify you from voting this year in Mississippi. That’s because some voter rolls in the Magnolia State contain more people registered to vote than people who are alive.
The dismal state of voter rolls in many Mississippi counties not only facilitates voter fraud, it violates federal law. Take Clarke County, for example: according the United States Census, in March 2015 Clarke County had 12,646 registered voters — despite having a voting-age population of only 12,549.
That’s a registration rate of over 100 percent. That’s not only implausible, it’s impossible.
On Monday, the Public Interest Legal Foundation sued the Clarke County Election Commission in federal court for violating its legal duty to keep its voter rolls current and accurate. The lawsuit should come as no surprise to the commission, which received written notice more than a year ago from the plaintiff — the American Civil Rights Union — that its voter rolls had become corrupted, but seemingly did nothing to correct the problem.
The National Voter Registration Act (NVRA) — commonly referred to as the “Motor Voter” law — requires each county to make a “reasonable effort” to remove the names of ineligible voters from the voter rolls when they either die or relocate to another voting jurisdiction. Although the law does not describe what constitutes a “reasonable effort,” having more than 100 percent of living citizens registered to vote certainly isn’t reasonable.
Wednesday, July 29, 2015
Yes, the middle class has been disappearing, but they haven't fallen into the lower class, they've risen into the upper class - AEI | Carpe Diem Blog » AEIdeas
Yes, the middle class has been disappearing, but they haven't fallen into the lower class, they've risen into the upper class - AEI | Carpe Diem Blog » AEIdeas

The chart and this post were inspired by a comment made by Ken on this CD post earlier today on middle-class incomes over time and the myth of middle-class stagnation. Ken points to Census Bureau Table 696 as evidence that the reason the middle class appears to be “disappearing” is because that income group is actually “disappearing” or moving into the upper class, and not falling into the lower class as is typically claimed.
Here’s what the family income distribution data in the chart above show:
1. In 1967, almost 62% of American families were earning between $25,000 and $75,000 in constant 2009 dollars, an income range that might accurately describe America’s “middle class.” Also in that year, fewer than one out of six (16.3%) American families had income above $75,000 (upper class), and 22% of families were earning $25,000 or less, an income category that might be described as “lower class.” In 1967, there were almost four American families earning a middle-class income ($25,000 to $75,000) for every high-income family earning above $75,000. Further, there were almost three “middle-income” families for every one “low-income family,” so the middle class American families earning between $25,000 and $75,000 clearly represented a significant share of US families.
Here’s what happened over time:
2. The share of lower-income families fell over time by 4.2 percentage points, from 22% of all US families in 1967 to only 17.8% of all US families in 2009, while the share of middle-income families decreased by 18.6 percentage points during that period, from 61.8% in 1969 to 43.2% in 2009. So where did those 22.8% of families go that disappeared from the lower income and middle income categories in the 42-year period between 1967 and 2009? They “disappeared” into the upper-income category of incomes above $75,000, which increased by 22.8 percentage points, from a 16.3% share of American families in 1967 to a 39.1% share in 2009. Whereas “middle class” families were so numerous that they outnumbered “upper class” families by a ratio of almost 4:1 in 1967, so many American “middle class” families have moved by the 2000s to the “upper class” by income, that those two groups have been almost equally represented for their shares of the total number of US families over the last decade (see the convergence of the blue and red lines in the chart above).
Bottom Line: In other words, America’s “middle class” did start largely disappearing in the 1970s, but it was because they were moving up to a higher-income category, not down into a lower-income category. And that movement was so significant that between 1967 and 2009, the share of American families earning incomes above $75,000 more than doubled, from 16.3% to 39.1%. On the previous CD post, Ken commented that although “Many prominent people like Paul Krugman claim that the middle class has been in decline since the 1970s, that assertion is incredibly and verifiably wrong.” And according to the percent distribution of family income data by income level (in constant dollars) in Table 696 from the Census Bureau, I think Ken is exactly right.
Monday, July 27, 2015
New IRS Documents Used Donor Lists to Target Audits
New IRS Documents Used Donor Lists to Target Audits
(Washington, DC) – Judicial Watch announced today that it has obtained documents from the Internal Revenue Service (IRS) that confirm that the IRS used donor lists to tax-exempt organizations to target those donors for audits. The documents also show IRS officials specifically highlighted how the U.S. Chamber of Commerce may come under “high scrutiny” from the IRS. The IRS produced the records in a Freedom of Information lawsuit seeking documents about selection of individuals for audits, based upon application information and donor lists submitted by Tea Party and other 501(c)(4) tax-exempt organizations (Judicial Watch v. Internal Revenue Service (No. 1:15-cv-00220)).
A letter dated September 28, 2010, then-Democrat Senate Finance Committee Chairman Max Baucus (D-MT) informs then-IRS Commissioner Douglas Shulman: “ I request that you and your agency survey major 501(c)(4), (c)(5) and (c)(6) organizations …” In reply, in a letter dated February 17, 2011, Shulman writes: “In the work plan of the Exempt Organizations Division, we announced that beginning in FY2011, we are increasing our focus on section 501(c)(4), (5) and (6) organizations.”
Sunday, July 26, 2015
The Story of Moira Greyland (Guest Post) | asktheBigot
The Story of Moira Greyland (Guest Post) | asktheBigot
A story of abuse, apparently let continue because of the protected status of the abusers.
A story of abuse, apparently let continue because of the protected status of the abusers.
Friday, July 24, 2015
Minimum Wage & Rent Control -- the Political Left Doesn't Care If They Work | National Review Online
Minimum Wage & Rent Control -- the Political Left Doesn't Care If They Work | National Review Online
There is no way to know what is going on in someone else’s mind. But sometimes his behavior tells you more than his words.
The political Left’s great claim to authenticity and honor is that what they advocate is for the benefit of the less fortunate. But how could we test that?
T. S. Eliot once said, “Half the harm that is done in this world is due to people who want to feel important. They don’t mean to do harm — but the harm does not interest them. Or they do not see it, or they justify it because they are absorbed in the endless struggle to think well of themselves.”
This suggests that one way to find out if those who claim to be trying to help the less fortunate are for real is to see if they are satisfied to simply advocate a given policy and see it through to being imposed — without also testing empirically whether the policy is accomplishing what it set out to do.
The first two steps are enough to let advocates feel important and righteous. Whether you really care about what happens to the supposed beneficiaries of the policy is indicated by whether you bother to check out the empirical evidence afterwards.
Many, if not most, people who are zealous advocates of minimum-wage laws, for example, never check to see if these laws do more good by raising some workers’ wages than harm by preventing many young and inexperienced workers from finding jobs.
One of my own pieces of good fortune, when I left home at age 17, was that the unemployment rate for black 17-year-old males was in single digits that year — for the last time. The minimum-wage law was ten years old, and the wage specified in that law was now so low that it was irrelevant, after years of inflation. It was the same as if there were no minimum-wage law.
Liberals, of course, wanted the minimum wage raised, to keep up with inflation. The result was that, ten years later, the unemployment rate for black 17-year-old males was 27.5 percent — and it has never been less than 20 percent in all the years since then.
As the minimum wage kept getting raised, so did the unemployment rate for black 17-year-old males. In 1971 it was 33.4 percent — and it has never been under 30 percent since then. It has often been over 40 percent and, occasionally, over 50 percent.
But people who advocate minimum-wage laws seldom show any interest in the actual consequences of such laws, which include many idle young males on the streets, which does no good for them or for their communities.
Advocates talk about people who make minimum wages as if they were a permanent class of people. In reality, most are young, inexperienced workers, and no one stays young permanently. But they can stay inexperienced for a very long time, damaging their prospects of getting a job and increasing their chances of getting into trouble, hanging out with other idle and immature males.
There is the same liberal zeal for government intervention in housing markets, and the same lack of interest in checking out what the actual consequences are for the people who are supposed to be the beneficiaries of government housing policies, whether as tenants or home buyers.
Government pressures and threats forced mortgage lenders to lower their lending standards, to allow more low-income and minority applicants to qualify. But, after the housing boom became a bust, the biggest losers were low-income and minority home buyers, who were unable to keep up the payments and lost everything — which was the very reason they were turned down before lending standards were lowered.
Rent-control laws have led to housing shortages in cities around the world. More than a thousand apartment buildings have been abandoned by their owners in New York alone — more than enough to house all the homeless in the city.
High tax rates on “the rich” — however defined — are an ever popular crusade on the left. Who cares about the consequences — such as the rich investing their money overseas, where it will create jobs and economic growth in other countries, while American workers are unemployed and American economic growth is anemic?
All these policies allow the political Left to persist in their fact-free visions. And those visions in turn allow the Left to feel good about themselves, while leaving havoc in their wake.
Birtherism: Where it all began
Birtherism: Where it all began - Ben Smith and Byron Tau - POLITICO.com
A brief history of birtherism Birtherism is the latest and most enduring version of a theory in search of facts.
The original smear against Obama was that he was a crypto-Muslim, floated in 2004 by perennial Illinois political candidate and serial litigant Andy Martin. Other related versions of this theory alleged that Obama was educated in an Indonesian “madrassa” or steeped in Islamist ideology from a young age, and the theories began to spread virally after Obama appeared on the national stage – to the casual observer, from nowhere – with his early 2007 presidential campaign announcement. (See: Obama kin: Birther rumors 'a shame')
All through that year, the Obama campaign – with the affirmation of most leaders of both parties – aggressively battled that smear by emphasizing his Christian faith. Obama’s controversial but emphatically Christian pastor emerged as a campaign issue and the belief that he was a Muslim seemed to lose traction. (See: Clinton: Birther claims 'ludicrous')
Then, as Obama marched toward the presidency, a new suggestion emerged: That he was not eligible to serve. (See: Birther debate alive across U.S.)
That theory first emerged in the spring of 2008, as Clinton supporters circulated an anonymous email questioning Obama’s citizenship.
“Barack Obama’s mother was living in Kenya with his Arab-African father late in her pregnancy. She was not allowed to travel by plane then, so Barack Obama was born there and his mother then took him to Hawaii to register his birth,” asserted one chain email that surfaced on the urban legend site Snopes.com in April 2008.
Wednesday, July 22, 2015
Luskin makes more mistakes on the Cambrian and Cladistics - The Panda's Thumb
This week, the Discovery Institute Press put out another book called Debating Darwin’s Doubt. I took one for the team and bought it, in part because a a decent chunk of the book is responding to me. I’m pretty sure I’ve never been mentioned so much in a book!
Sadly, though, looking through it, almost all of it is material re-hashed from the DI “Evolution News and Views” blog and is no better than it was the first time. There is, however, a new chapter (I think it is new) by Casey Luskin, chapter 9, “Cladistics to the Rescue?” responding to me. If you don’t want to buy the book, there is a free podcast at ID the Future (heh), “Debating Darwin’s Doubt: Casey Luskin on Classification of Organisms” that interviews Luskin (although I think he wrote the questions). It has mostly the same material.
Monday, July 20, 2015
Voter ID, Suppression Fail - Hit & Run : Reason.com
Voter ID, Suppression Fail - Hit & Run : Reason.com
But if the intent of the new laws really is to suppress minority group voting, it's not likely to work. There has been a lot of academic research recently on the effects of stricter voter ID requirements, and—contrary to Barber's apocalyptic statements—they don't seem to have much of an impact on minority turnout at all.
Take "The Politics of Race and Voter ID Laws in the States: The Return of Jim Crow?," a 2013 study published in thePolitical Research Quarterly. In it, political scientists Rene Rocha and Tetsuya Matsubayashi find that states in which Republicans hold a majority in the legislature and the governorship are more likely to adopt strict voter ID laws. (And so it was in North Carolina when the new laws were adopted.) Then they look at how changes in electoral rules may have affected voter turnout by comparing election results before and after voter ID law changes in 49 states between 1980 and 2010.
"Our primary explanatory variables, photo ID and nonphoto ID laws, have no statistically discernible relationship with the probability that whites, blacks, and Latinos voted in the general elections between 1980 and 2010 except that the nonphoto ID law has a positive and significant relationship with Latino turnout," they find. "In short, more stringent ID requirements for voting have no deterring effect on individual turnout across different racial and ethnic groups."
Rocha and Matsubayashi speculate that any suppression effects the new laws may induce are being more than counteracted by get-out-the-vote efforts by partisan organizations that aim to mobilize minorities. The two also find that "universal mail voting, no-excuse absentee voting, and early in-person voting, have no systematic effect on turnout when racial and ethnic groups are analyzed separately."
In another recent paper, three political scientists from Berkeley and Columbia report the results of a field experiment involving voters in Appalachian Tennessee and Virginia matched for income, age, and minority-status in the 2012 general election. They also targeted voters in predominately black neighborhoods in Knoxville, Tennessee, and Roanoke, Virginia. Tennessee requires a photo ID to vote whereas Virginia requires a nonphoto ID, e.g., utility bills and bank statements showing the voter's address. The researchers mailed three different postcards to selected voters. One reminded them to vote; the second warned that voter ID requirements had changed ("warning"); the third warned that the ID requirements had changed but also explained how to get the appropriate IDs ("help"). A control group received no postcards.
The researchers reported that both white and black voters sent the reminder postcard voted at essentially no greater rate than the controls who did not receive postcards. On the other hand, both the warning and help postcards apparently boosted turnout by both white and black voters by around one percent. The researchers conclude. "We find no evidence that [stricter voter ID requirements] have a net demobilizing effect."
In a 2015 study that is currently under review, Lindsay Nielson—a political scientist at the University of San Diego—parses the effects of stricter voter ID laws on the voting patterns of the young, the elderly, the poor, and racial minorities. Using data on 100,000 respondents in Cooperative Congressional Election Survey, Nielson examines how voter ID laws affected turnout in both primary and general elections in 2010 and 2012.
Nielson finds that stricter voter ID laws do change the probability that someone will vote in primary elections, but not in general elections. In primaries, she reports, whites and minorities vote at approximately similar rates; turnout declines for people of all races from 43 to 31 percent, as ID requirements become stricter. Turnout among voters over age 65 declines from 57 to 48 percent in primary elections; among those ages 35 to 64, it drops from 42 to 34 percent; the young vote decreases from 30 to 22 percent. Income makes no difference; turnout declines about 10 percent both for people who make more than $40,000 per year and those who make less. She found similar results when the income cutoff was set at $20,000 per year.
General elections are another matter. Nielson finds that "there is little evidence that racial minorities are less likely than whites to vote when states institute voter identification requirements." The elderly vote drops a few percentage points when IDs are required, but the turnout of middle-aged and young voters does not change. There is also "no statistically significant gap in estimated turnout [between high-income and low-income voters] when the identification law becomes stricter."
Ultimately Lindsey reckons that her "findings demonstrate that the evidence that voter identification laws demobilize potential voters is not as strong as opponents of the laws might wish and that the controversy over these laws may be exaggerated." Whatever lawmakers' intentions may be when imposing more stringent voter ID requirements—to honorably prevent fraud or to dishonorably suppress votes—the data suggest that the requirements are a big waste of time and money.
Ancient Greeks highlight gay marriage flaws
Ancient Greeks highlight gay marriage flaws
Ancient Greeks highlight gay marriage flaws
I have many friends around the world, some of whom are gay, and some of whom are lesbian. At the heart of those friendships is a desire to see people for who they are, and not for the people with whom they have sex.
- Date
- July 1, 2015
- Bill O'Chee
Yet for all that, I do not support the state legislating to create a class of marriage between two men or two women. Moreover, I believe the arguments advanced in favour of gay marriage reflect poorly upon those who advocate for it.
Gay marriage is not about colouring your Facebook page avatar with a rainbow, nor is it about whether a man may have genuine feelings of love for another man, or a woman another woman. The discussion is, instead, about complex and fundamental issues not always properly considered.
If we go back over 2000 years, we find that both the Greeks and Romans were familiar with love and sex between people of the same gender. Indeed, for the Greeks, same sex relationships were neither uncommon, nor frowned upon; in fact they were probably much more common than they are today.
As was their way, the Greeks felt the need to use different words to describe what they saw as different types of love.
There could be agápe, brotherly love, or love of God; or storge, the love of parents and their children. The Greeks also spoke of philia, which was an idealised form of friendship based on equality and virtue; and of éros, which was sexual passion. Interestingly, éros was not restricted by gender.
Even in such a permissive society, gamos was reserved solely for a relationship between a man and a woman for the purposes of creating a family, even if that relationship might not originally be based on love.
There is much we can learn from the Greeks. The modern reality is that the vast majority of people who love each other live together without getting married, even if they may choose to do so later.
The law has moved to accommodate this, and common law couples are able to pass property to each other, to benefit from their partner's superannuation policy, and make decisions as next-of-kin, just the same as those who are married.
If that is so, why do heterosexual couples, who may have been living together for some time, choose to get married?
It is not about love, as that can be had perfectly well in a normal de facto relationship. In fact love - true and deep love - should not need outside validation, and should be independent of what others have to say.
Heterosexual couples don't need to marry to have children, as many children are born to de facto couples, even if some or many of those couples marry later.
However, the vast majority of heterosexual couples who chose to marry, either have children at the time, or intend to have them, and this is the impetus for marriage. Marriage gives those a stability and a clear identity that is the basis of their lifelong emotional development.
Certainly there may be people who marry who don't intend to have children, but they are a tiny minority, and certainly should not be used to characterise marriage.
So the truth is that marriage is not so much about love for our partner, as much as love for the children we hope to bring into the world.
It is at this point that the case for gay marriage starts to fall apart, because having children cannot ever be a natural consequence of two men or two women forming a union, no matter how genuine their emotions may be.
And if the motive for gay marriage is to make it easier for gay and lesbian couples to adopt children, or to access the powers of the state to bring children into the world through surrogacy or artificial insemination, then it is no longer about the love two people feel for each other, and more about wanting babies as lifestyle accessories.
This brings us to a broader, but important, philosophical issue.
I strongly believe the right to determine one's identity - sexual and otherwise - is one of the very few truly inalienable rights which society should accord every individual.
Determining our identity - and deciding on how we live our lives - necessarily involves many choices.
Choices, however, come with consequences. Those consequences are the very reason we make choices: we sum up the advantages and disadvantages each choice brings, and make our decisions on that basis.
To believe that we can make choices about the way we want to live our lives, and then have the state come in and relieve us of the consequences we don't like is deeply flawed. The whole basis of the law is built on people being responsible for the consequences of their actions, and marriage and families should be no different.
It is easy and glib to talk about "marriage equality" but what is more important is seeing through our choices to make sure they are meaningful. This doesn't diminish the love that gay and lesbian couples may feel for each other. However marriage has a real purpose which is larger than our love for ourselves or our partners, and it is selfish to see it otherwise.
Sunday, July 19, 2015
Even if false rape reports are rare, they shouldn't be ignored | Washington Examiner
Even if false rape reports are rare, they shouldn't be ignored | Washington Examiner
.Whenever a high-profile account of alleged campus sexual assault comes crashing down – such as Rolling Stone's gang-rape accusation – activists predictably fall back on the claim that only 2 percent of rape accusations are false.
.But let's look at that 2 percent figure as if it applied to all cases. If it were true that 2 percent of rape reports were proven to be false, that would indicate that 98 percent were proven to be true, and therefore, accusers should be believed as a matter of default.
The 2 percent figure is the low end of a range (usually up to 8 percent or 10 percent) from multiple studies conducted over the past few decades. The Washington Post, in an article fact-checking a graphic about rape statistics, mentioned a study from the "Making A Difference" Project, which the National Center for the Prosecution of Violence Against Women claimed was the "only research conducted in the U.S. to evaluate the percentage of false reports made to law enforcements."
Assuming that's true (it's not), it would be the only relevant study to use as a basis for false accusations. But that study actually found 7.1 percent of rape reports to be "unfounded/false." But one can't assume that means 92.9 percent of reports were true. The study found an additional 8.5 percent to be classified as "unfounded/baseless." End Violence Against Women International, which produced the MAD study, defined baseless reports as "those that do not meet the elements of the offense and those that were improperly coded as a sexual assault in the first place." This includes sexual assault reports in which a "follow-up investigation reveals either that no crime occurred or that some other type of crime was actually committed (or attempted)." In other words, a false report of rape.
That would bring the number of false rape reports up to 15.6 percent. Another category of rape reports in the MAD study (making up 17.9 percent of the cases) was "closed as an informational report." This categorization occurred when a person reported a sexual assault that did not meet the criteria of a crime. It doesn't mean the person made up the entire story, but what they reported wasn't a crime. This wouldn't be counted as false, but it also isn't in the "true" category, as a crime wasn't actually committed. "Suspended/inactivated" constituted another 28.6 percent of the cases studied by MAD. These are the cases in which there isn't enough evidence to say whether a crime actually occurred.
The next category was "exceptionally cleared," making up 17.9 percent of the total cases studied. EVAW defines these cases as those where an offender is identified, there is enough evidence for arrest but something "beyond the control of law enforcement precludes arresting," such as the death of the suspect or a lack of victim cooperation after the identification.
The final category, 20 percent of the total cases, was those "cleared by arrest." This would seem to indicate that at least 20 percent of rape reports were true, but remember, an arrest does not equal guilt. Another chart in the MAD study has the breakdown of outcomes after the case was referred to prosecution. A whopping one-third (33.2 percent) of cases were rejected by the prosecution, another 20.9 percent were dismissed with all charges dropped and 2.3 percent were dismissed but the charges weren't dropped. Two percent of the cases referred to prosecutors resulted in a trial and a "not guilty" finding. Another third (33.2 percent) resulted in a guilty plea, and just 5.9 percent went to trial and received a "guilty" finding (2.6 percent were classified as "other").
So what does this all mean? Francis Walker, who runs an exceptional blog taking down statistics such as the MAD study, has done the math. He found that from all the statistics listed above, just 7.8 percent of rape reports in the MAD study could be classified as true.
"From this we can see that 39.1% of the cases end in either a guilty verdict or a guilty plea. Multiplying that by the 20% of police cases that result in arrest, we are left with the 7.8% I used at the start of my first post," Walker wrote. "Even this isn't a good number to use though. If a confession that a report is false isn't enough to classify the report as false, then the corollary is that a guilty plea isn't enough to classify a case as true. After all, it would not be difficut [sic] to imagine a scenario where, for any number of reasons, someone pleads guilty to a crime that they didn't commit. 20% x 5.9% leaves us with a 'true' rate of just 1.2%. Even if we decide to be generous and include not just the 20% arrested, but also the 17.9% exceptionally cleared, the number still only goes up to 2.2%."
From all of this one could determine that 15.6 of reports could reliably be determined as false, another 17.9 percent weren't actually crimes and just 1.2 percent (or 2.2 percent) could be reliably determined as true. The remainder would fall into a "we'll never know for sure" category.
Perhaps only 2 percent of rape reports are false. That doesn't necessarily mean that 98 percent are true. But assuming that is the case, one can't possibly know which category a report falls into until after a proper investigation (which would include due process). And to pretend that false reports don't happen just because they are rare minimizes the impact such reports have on those falsely accused.
FDR's policies prolonged Depression by 7 years, UCLA economists calculate | UCLA
FDR's policies prolonged Depression by 7 years, UCLA economists calculate | UCLA
Two UCLA economists say they have figured out why the Great Depression dragged on for almost 15 years, and they blame a suspect previously thought to be beyond reproach: President Franklin D. Roosevelt.
After scrutinizing Roosevelt's record for four years, Harold L. Cole and Lee E. Ohanian conclude in a new study that New Deal policies signed into law 71 years ago thwarted economic recovery for seven long years.
"Why the Great Depression lasted so long has always been a great mystery, and because we never really knew the reason, we have always worried whether we would have another 10- to 15-year economic slump," said Ohanian, vice chair of UCLA's Department of Economics. "We found that a relapse isn't likely unless lawmakers gum up a recovery with ill-conceived stimulus policies."
In an article in the August issue of the Journal of Political Economy, Ohanian and Cole blame specific anti-competition and pro-labor measures that Roosevelt promoted and signed into law June 16, 1933.
"President Roosevelt believed that excessive competition was responsible for the Depression by reducing prices and wages, and by extension reducing employment and demand for goods and services," said Cole, also a UCLA professor of economics. "So he came up with a recovery package that would be unimaginable today, allowing businesses in every industry to collude without the threat of antitrust prosecution and workers to demand salaries about 25 percent above where they ought to have been, given market forces. The economy was poised for a beautiful recovery, but that recovery was stalled by these misguided policies.
Using data collected in 1929 by the Conference Board and the Bureau of Labor Statistics, Cole and Ohanian were able to establish average wages and prices across a range of industries just prior to the Depression. By adjusting for annual increases in productivity, they were able to use the 1929 benchmark to figure out what prices and wages would have been during every year of the Depression had Roosevelt's policies not gone into effect. They then compared those figures with actual prices and wages as reflected in the Conference Board data.
In the three years following the implementation of Roosevelt's policies, wages in 11 key industries averaged 25 percent higher than they otherwise would have done, the economists calculate. But unemployment was also 25 percent higher than it should have been, given gains in productivity.
Meanwhile, prices across 19 industries averaged 23 percent above where they should have been, given the state of the economy. With goods and services that much harder for consumers to afford, demand stalled and the gross national product floundered at 27 percent below where it otherwise might have been.
"High wages and high prices in an economic slump run contrary to everything we know about market forces in economic downturns," Ohanian said. "As we've seen in the past several years, salaries and prices fall when unemployment is high. By artificially inflating both, the New Deal policies short-circuited the market's self-correcting forces."
Saturday, July 18, 2015
Voter ID: Other Countries Require It | National Review Online
Voter ID: Other Countries Require It | National Review Online
The vast majority of countries require voter ID — usually photo ID — to prevent fraud and duplicate votes at the polls. Our neighbors do. Canada requires voter ID. Mexico’s “Credencial para Votar” has a hologram, a photo, and other information embedded in it, and it is impossible to effectively tamper with. Confidence in the integrity of elections has soared since its introduction in the 1990s.
Does the government subsidize low-wage employers? | Brookings Institution
Does the government subsidize low-wage employers? | Brookings Institution
.many readers interpreted the government aid dollars to represent a subsidy to low-wage employers (for example, here,here, and here). According to this view, government assistance to low-income families constitutes a handout to Walmart, McDonalds, and other low-wage employers. The assistance allows these companies to pay their workers lower wages than would be possible in the absence of the government aid.For the majority of programs analyzed by the Berkeley researchers, this interpretation of government assistance payments is flatly wrong. Instead of subsidizing low-wage employers, most assistance programs reduce the availability of low-skill adults who are willing to work for low pay and lousy benefits. By shrinking the pool of workers willing to take the worst jobs, the programs tend to push up rather than push down wages at the bottom of the pay scale. Low-wage employers do not receive an indirect subsidy from the programs. Many must pay somewhat higher wages or recruit more intensively to fill their job vacancies.
The public programs singled out in the Berkeley report are aimed at improving the health care access, nutrition, and net incomes of the nation’s most disadvantaged families. Three of the programs provide more assistance to nonworking Americans and their dependents than to families containing a working breadwinner. It is hard to see how this kind of program can be said to provide a subsidy to low-wage employers. Two programs that restrict benefit payments to working breadwinners—EITC and daycare subsidies—surely succeed in improving the net incomes of working but struggling parents. Indirectly the two programs increase the supply of low-wage workers, putting some downward pressure on wages. Labeling these programs as “subsidies” to low-wage employers has some merit, but it fundamentally misrepresents the distribution of benefits conferred by the programs. The main effect of the subsidies is to lift the net incomes of the working families that receive them.
Thursday, July 16, 2015
Your country, your vote – a rough guide to global voter restrictions | International Consortium of Investigative Journalists
Your country, your vote – a rough guide to global voter restrictions | International Consortium of Investigative Journalists
The controversy over America’s restrictive voting laws – which supporters describe as necessary to prevent fraud and ensure uniformity among different regions – raised a question that is global in scope. We at ICIJ wanted to know: how restrictive are voting requirements in nations around the world?
To answer the question, ICIJ compared data in three areas that play a key role in the relative ease of voting. We examined the strictness of voting and registration ID requirements, whether voter registration is automatic or must actively be pursued by citizens, and whether certain groups such as felons and citizens with mental disabilities are prohibited from voting. The data covers between 65 and 234 countries, with the number of countries included varying by category.
Tuesday, July 14, 2015
The real value of $100 by State
The Tax Foundation has compiled a list of the buying power of $100 in each state. The map is at this link.
It's interesting to look at the averages for red and blue states, using the table from a few days ago.
Averaged over red states, the buying power of $100 is $108.76, and averaged over the blue states its $97.82.
The states where $100 is worth the most are Mississippi ($115.21) Arkansas ($114.29) South Dakota ($114.16) Alabama ($114.03) and West Virginia ($113.12). In contrast, $100 is effectively worth the least in the District of Columbia ($84.96) Hawaii ($86.06) New York ($86.73) New Jersey ($87.34) and California ($89.05.)
It's interesting to look at the averages for red and blue states, using the table from a few days ago.
Averaged over red states, the buying power of $100 is $108.76, and averaged over the blue states its $97.82.
Monday, July 13, 2015
Trump Was Right
Trump Was Right
Donald Trump has been roundly criticized by both Democrats and Republicans for saying that 80 percent of women crossing the border are being raped. NBC decided to drop his popular show, “The Apprentice,” and the Miss Universe pageant he produces. Mexico says it will withdraw its entrant to the pageant based on Trump’s offensive statements. ESPN, NASCAR and others have piled on. But Trump was just quoting an article from Fusion magazine. The piece, “ Is rape the price to pay for migrant women chasing the American Dream?” leads off by saying:
“Before they can reach the American Dream, many migrant women have to survive a Mexican nightmare. A staggering 80 percent of Central American girls and women crossing Mexico en route to the United States are raped along the way, according to directors of migrant shelters interviewed by Fusion.”
In fact, the problem is infinitely worse than the article reveals. For example, of 61,529 criminal cases initiated by federal prosecutors in 2013, 24,746 — fully 40 percent of the total—originated in five border jurisdictions in Arizona, New Mexico, Southern California, West Texas and South Texas. Almost all were committed by illegals.
The Government Accountability Office (GAO) in its 2011 report, Criminal Alien Statistics, included a review of 249,000 criminal aliens. They were arrested a total of 1.7 million times, an average of about seven arrests per alien. Among them they committed 2.9 million crimes. Roughly 50 percent were arrested at least once for either assault, homicide, robbery, sex crimes or kidnapping. Here are the eye-popping stats:
- Homicide: 25,064 (8% of total)
- Sex Offenses: 69,929 (12%)
- Assault: 213,047 (35%)
- Kidnapping: 14,788 (4%)
But this doesn’t provide any context. These crimes were committed over multiple years. It is obviously significant, but difficult to tell how these figures stack up to the total without reviewing all crimes committed during the measured period. And since the period involved was not defined, it becomes impossible. However, the following statistics will help put this situation in proper perspective.
The GAO studied a subset of five states with large illegal alien populations: New York, Florida, Arizona, Texas and California. At the time of the study, the latest data available were for 2008. In New York, 28 percent of illegal alien convictions in 2008 were for murder. Another 11 percent were sex offenses. That sounds like a lot, but the GAO did not provide the numbers that generated those percentages, so a FOIA request was submitted.
The unpublished numbers provided by the GAO have been placed side-by-side against the total of each type of crime committed in each state in 2008 (total state numbers available here):
New York
Total Murders: 835. Illegal Alien Murder Convictions: 1,168 (140% of total)
Total Sex Crimes: 2,775; Illegal Alien Sex Crimes: 459 (17% of total).
New York Illegal Alien Population: 2.9% of total
California
Total Murders: 2,143. Illegal Alien Murder Convictions: 2,859 (135% of total)
Total Sex Crimes: 8,906; Illegal Alien Sex Crimes: 3,325 (37% of total)
California Illegal Alien Population: 7.3% of total
Texas
Total Murders: 1,373. Illegal Alien Murder Convictions: 934 (68% of total)
Total Sex Crimes: 8,004; Illegal Alien Sex Crimes: 1,825 (23% of total)
Texas Illegal Alien Population: 6.8% of total
Arizona
Total Murders: 404. Illegal Alien Murder Convictions: 326 (81% of total)
Total Sex Crimes: 1,654; Illegal Alien Sex Crimes: 391 (24% of total)
Arizona Illegal Alien Population: 5.2% of total
Florida
Total Murders: 1,169. Illegal Alien Murder Convictions: 1,762 (151% of total)
Total Sex Crimes: 5,972; Illegal Alien Sex Crimes: 2,971 (50% of total)
Florida Illegal Alien Population: 3.7% of total
Consider these facts. While illegal aliens compose just 2.9% of New York’s population, (if Census figures are to be believed), more illegals were convicted of murder in 2008 than the total number of murders committed that year!
The reason convictions exceed state total crimes in some cases is because the convictions are for crimes that may not have been committed that year, but went to trial in 2008.
Sunday, July 12, 2015
Homosexuality and Christian apologetics
Homosexuality and Christian apologetics
Argument from the first century environment
One argument I see is that homosexuality is condemned only about three times in the New Testament so they cannot really have meant it seriously. If it really was a serious concern it would have been mentioned more often. And Christ himself did not mention it at all. Allied to that is an argument that Christ and the apostles lived in a Greco-Roman world where homosexuality was normal, common and unquestioned so it cannot have been seen as very wrong or it would have been condemned out of hand.
That is the sort of argument you might get from the U.S. Supreme Court -- one that completely ignores what the documents actually say -- and it seems to me to be an argument of desperation. But let me point out the simple and major flaw in it anyway.
Christ and the early Christians lived in an environment that was overwhelmingly Jewish. And Jews had always stood out in their rejection of homosexuality (Leviticus 18:22 etc.). They did indeed live in a Greco-Roman world and pedophilia had been routinely practiced by the Greeks for centuries -- something that the unfortunate Chris Brand got fired for after he pointed that out once too often.
But Israel was not Greece then any more than it is today. Regardless of what other subjects of the Roman empire might say or do, Jews lived in a society where homosexuals risked being stoned to death. Rejection of homosexuality could be taken as read in that environment so needed only incidental mention. And when the apostle Paul did in fact comment directly on Roman civilization, he absolutely ranted and raved in his condemnation of it.
Paul started travelling very early on and so came into much more contract with Greco-Roman civilization than one would have done in Israel. Most of his missions were at least initially to congregations of the Jewish diaspora so he still lived in something of a Jewish bubble. But when it came to Rome itself he could not restrain himself. He condemned just about everything Roman.
Read what he says about Roman practices in his epistle to the Christians in Rome, chapter 1, from verse 21 onwards. Being a good theologian, Paul puts his condemnation in the context of what Jewish backsliders in the past had done but there is no ambiguity about the general applicability of what he says. And he is clearly motivated by what he has observed of Roman civilization, which is why he felt the need say it when writing to the congregation in Rome. So on occasions when it was needful to condemn homosexuality, the Bible writers did just that. I quote from verse 27:
"And likewise also the men, leaving the natural use of the woman, burned in their lust one toward another; men with men working that which is unseemly, and receiving in themselves that recompence of their error which was meet".
And in the final verse of the chapter Paul moves into the present tense, indicating that it is the malign influence of then-current Roman civilization on Christians that he has particularly in mind:
"Who knowing the judgment of God, that they which commit such things are worthy of death, not only do the same, but have pleasure in them that do them"
What did Christ say?
A related argument is that Christ never mentioned homosexuality so it was only that old puritan Paul who thought it was a bad thing. Since Paul's writings form a large part of the New Testament, that is simply a repudiation of the Bible and is, if anything, an anti-Christian argument and reveals those who put it forward for what they are: Disciples of Satan maybe but certainly not disciples of Christ.
But, that aside, context again is explanatory. Because Christ was a devout Jew in a Jewish society, the question never arose. It was not an issue. The Jewish law still unquestionably applied. Let me quote the only thing that Christ said about marriage -- in Matthew 19. He specifically put his teaching in the context of a debate about Jewish law:
"Some Pharisees came to him to test him. They asked, “Is it lawful for a man to divorce his wife for any and every reason?”
“Haven’t you read,” he replied, “that at the beginning the Creator ‘made them male and female,’ and said, ‘For this reason a man will leave his father and mother and be united to his wife, and the two will become one flesh'. So they are no longer two, but one flesh. Therefore what God has joined together, let no one separate.”
Clearly, for him, marriage was between a man and a woman and it was only they who could become "one flesh". And his authority for that was what was found in the Jewish scriptures. So there is no doubt whatever about his view of sexual relationships. Only male/female marriage was on his horizons.
Universal salvation?
A remaining argument from the pseudo Christians is that God is a God of love so therefore he must love homosexuals too. That is also an amazing argument. The Bible repeatedly makes clear that God loves his children but, like any parent, he also has rules for his children. And just as children can be disinherited, so God can sentence unrighteous people to everlasting "kolasin" (cutting off). Let me quote Matthew 25.
"When the Son of man shall come in his glory, and all the holy angels with him, then shall he sit upon the throne of his glory: And before him shall be gathered all nations: and he shall separate them one from another, as a shepherd divideth his sheep from the goats: And he shall set the sheep on his right hand, but the goats on the left. Then shall the King say unto them on his right hand, Come, ye blessed of my Father, inherit the kingdom prepared for you from the foundation of the world ...
Then shall he say also unto them on the left hand, Depart from me, ye cursed, into everlasting fire, prepared for the devil and his angels. And these shall go away into everlasting punishment: but the righteous into life eternal"
The word translated as "punishment" above is in Greek "kolasin" and it simply means "cutting off". It is the word a Greek gardener might use to describe the pruning of a tree. So it would be a proper translation to say that the goatish ones will be cut off and thrown away like the unwanted branch of a tree.
So the argument that the love of God is unconditional is utter rubbish. You have to do your best to obey his rules if you want salvation from death. There is no universal salvation.
So those are the arguments that the pseudo-Christians use. They are so weak that you could only accept them out of desperation. You could only accept them if you wanted to use Christianity as a false front. They are arguments that mock the Bible, not arguments from the Bible -- JR.
Saturday, July 11, 2015
Ranking the States by Fiscal Condition | Mercatus
Ranking the States by Fiscal Condition | Mercatus
It was pointed out the best run states tend to be red (voted for Romney in 2012) and the worst run tend to be blue (voted for Obama in 2012).
The average rank of the red states is 18.4; of blue states, 32.0.
The average Fiscal Condition Index for the red states is 0.72, and for the blue ones, -0.67.
Alaska is an outlier, possibly because of its oil revenue. If its FCI is replaced with a value of 0.4, the average FCI for the red states decreases to 0.4.
State Red/Blue Fiscal rank Fiscal Condition Index ALASKA R 1 8.26 NORTH DAKOTA R 2 2.97 SOUTH DAKOTA R 3 2.84 NEBRASKA R 4 2.75 FLORIDA B 5 2.74 WYOMING R 6 2.67 OHIO B 7 1.3 TENNESSEE R 8 1.1 OKLAHOMA R 9 0.99 MONTANA R 10 0.98 UTAH R 11 0.95 NEVADA B 12 0.62 ALABAMA R 13 0.6 MISSOURI R 14 0.49 IDAHO R 15 0.32 INDIANA R 16 0.07 SOUTH CAROLINA R 17 -0.03 IOWA B 18 -0.04 TEXAS R 19 -0.12 NEW HAMPSHIRE B 20 -0.13 VIRGINIA B 21 -0.21 COLORADO B 22 -0.27 WASHINGTON B 23 -0.43 KANSAS R 24 -0.48 OREGON B 25 -0.5 GEORGIA R 26 -0.58 NORTH CAROLINA R 27 -0.63 WISCONSIN B 28 -0.64 ARKANSAS R 29 -0.66 DELAWARE B 30 -0.69 MINNESOTA B 31 -0.7 ARIZONA R 32 -0.78 MISSISSIPPI R 33 -0.78 MICHIGAN B 34 -0.8 LOUISIANA R 35 -0.85 NEW MEXICO B 36 -0.92 MARYLAND B 37 -0.98 RHODE ISLAND B 38 -1.06 VERMONT B 39 -1.08 HAWAII B 40 -1.08 PENNSYLVANIA B 41 -1.14 MAINE B 42 -1.15 WEST VIRGINIA R 43 -1.2 CALIFORNIA B 44 -1.41 KENTUCKY R 45 -1.42 NEW YORK B 46 -1.49 CONNECTICUT B 47 -1.83 MASSACHUSETTS B 48 -1.84 NEW JERSEY B 49 -1.86 ILLINOIS B 50 -1.86
Monday, July 06, 2015
How to fake a rise in ‘right-wing terror’ | New York Post
How to fake a rise in ‘right-wing terror’ | New York Post
How much should we worry about Islamic terrorism? How much should we worry about other kinds?
There’s no exact right answer to this question. Who’s out there in dark places plotting murder most foul?
We can only guess, using imperfect information. Of course, there’s “imperfect” and then there’s downright distorted.
The New York Times highlighted one data set recently, in an article headlined “Homegrown Extremists Tied to Deadlier Toll Than Jihadists in US Since 9/11.”
The article goes on to cite a nationwide survey asking police and sheriffs departments the biggest extremist threats in their jurisdiction, noting that “74 percent listed antigovernment violence, while 39 percent listed ‘Al Qaeda-inspired’ violence, according to the researchers.”
The most obvious problem to note is the choice of start date: Sept. 12, 2001. That neatly excludes an attack that would dwarf all those homegrown terror attacks by several orders of magnitude.
Ah, you will say, but that was a one-time event.
Sort of. It’s no longer possible to destroy the World Trade Center, but we can’t be certain to never again have a large-scale terror attack that kills many people.
If you have high-magnitude but low-frequency events, then during most intervals you choose to study, other threats will seem larger — but if you zoom out, the big, rare events will still kill more people.
We don’t say that California should stop worrying about earthquake-proofing its buildings, just because in most years bathtub drownings are a much larger threat to its citizens.
The other thing to ask is how we’re defining a terror event and classifying the motivation.
I took a little stroll through the underlying data, and on the “jihadist violence” side, the definition is pretty clear. Counting the other types of extremist terrorism, however, is a little murkier.
The data set the Times relies on includes Andrew Joseph Stack, who you may remember piloted a small plane into an IRS building in Austin, Texas.
Stack left a manifesto behind, and it doesn’t exactly read like an anarcho-capitalist treatise. Oh, he’s mad at the government, all right, but he’s mad about . . . the 1986 revision to Section 1706 of the tax code, which governs the treatment of technical contractors. Plus the Catholic Church, Wall Street, health insurers and George W. Bush.
He closes his manifesto with, “The communist creed: From each according to his ability, to each according to his need. The capitalist creed: From each according to his gullibility, to each according to his greed.”
Labeling this as a “deadly right-wing attack” is beyond a stretch; it’s not even arguably correct.
Nor is this the only questionable inclusion. Consider Raymond Peake, who was convicted of shooting someone at a firing range, apparently in the course of stealing his gun.
He appears to be on the list on the basis of a single vague statement from law-enforcement that Peake had been stealing guns for an unidentified organization aimed at overthrowing the US government.
Then there was Joshua Cartwright of Ft. Walton Beach, Fla., who shot two deputies when his wife called the cops to stop him from hitting her.
This was elevated to a “deadly right- wing attack” because, according to New America and cited by the Times, “Cartwright had a history of non-compliance with the police and Cartwright’s wife told police that he held anti-government views and was ‘severely disturbed’ by President Obama’s election.”
The case of Robert Poplawski is similarly questionable. He ambushed three officers who responded when his mother called the police on him.
Add to the list of “not clear what he was thinking, but probably not domestic terrorism” Curtis Wade Holley, who set fire to his own home and then shot at the first responders.
The timeline suggests he was upset because his ex-girlfriend finally had his utilities shut off and he was worried about being evicted or losing his car, something he’d vowed not to endure without a fight. I find it very hard to understand why these cases were included, except to pad out the count of “deadly right-wing attacks.”
I’m also somewhat dubious about Albert Gaxiola, Shawna Forde and Joshua Bush, who killed Raul Flores and his 9-year-old daughter while robbing their house.
The database says “The three conducted the robbery to help fund their anti-immigrant organization.” But prosecutors told jurors that “it was Gaxiola who suggested Forde and Bush ought to rob and kill Flores. Gaxiola wanted Flores dead because he was a rival drug smuggler.”
And once you start throwing in the gray cases on the right-wing side, shouldn’t we be similarly permissive when categorizing violence as Islamic terror?
In prison, one of the Beltway snipers penned rambling anti-American screeds in which, according to The Baltimore Sun, “the most recurring theme is that of jihad — or holy war — against America.”
The Beltway snipers killed 10 people, which all by itself would bring the number of jihadist killings up to 36 from the Times’ quoted number of 26.
Then the story becomes less “right-wing terror is much more dangerous than jihad” and more “Muslim terrorists have killed some people in the United States, and other kinds of ideological murderers have, too.”
Thursday, July 02, 2015
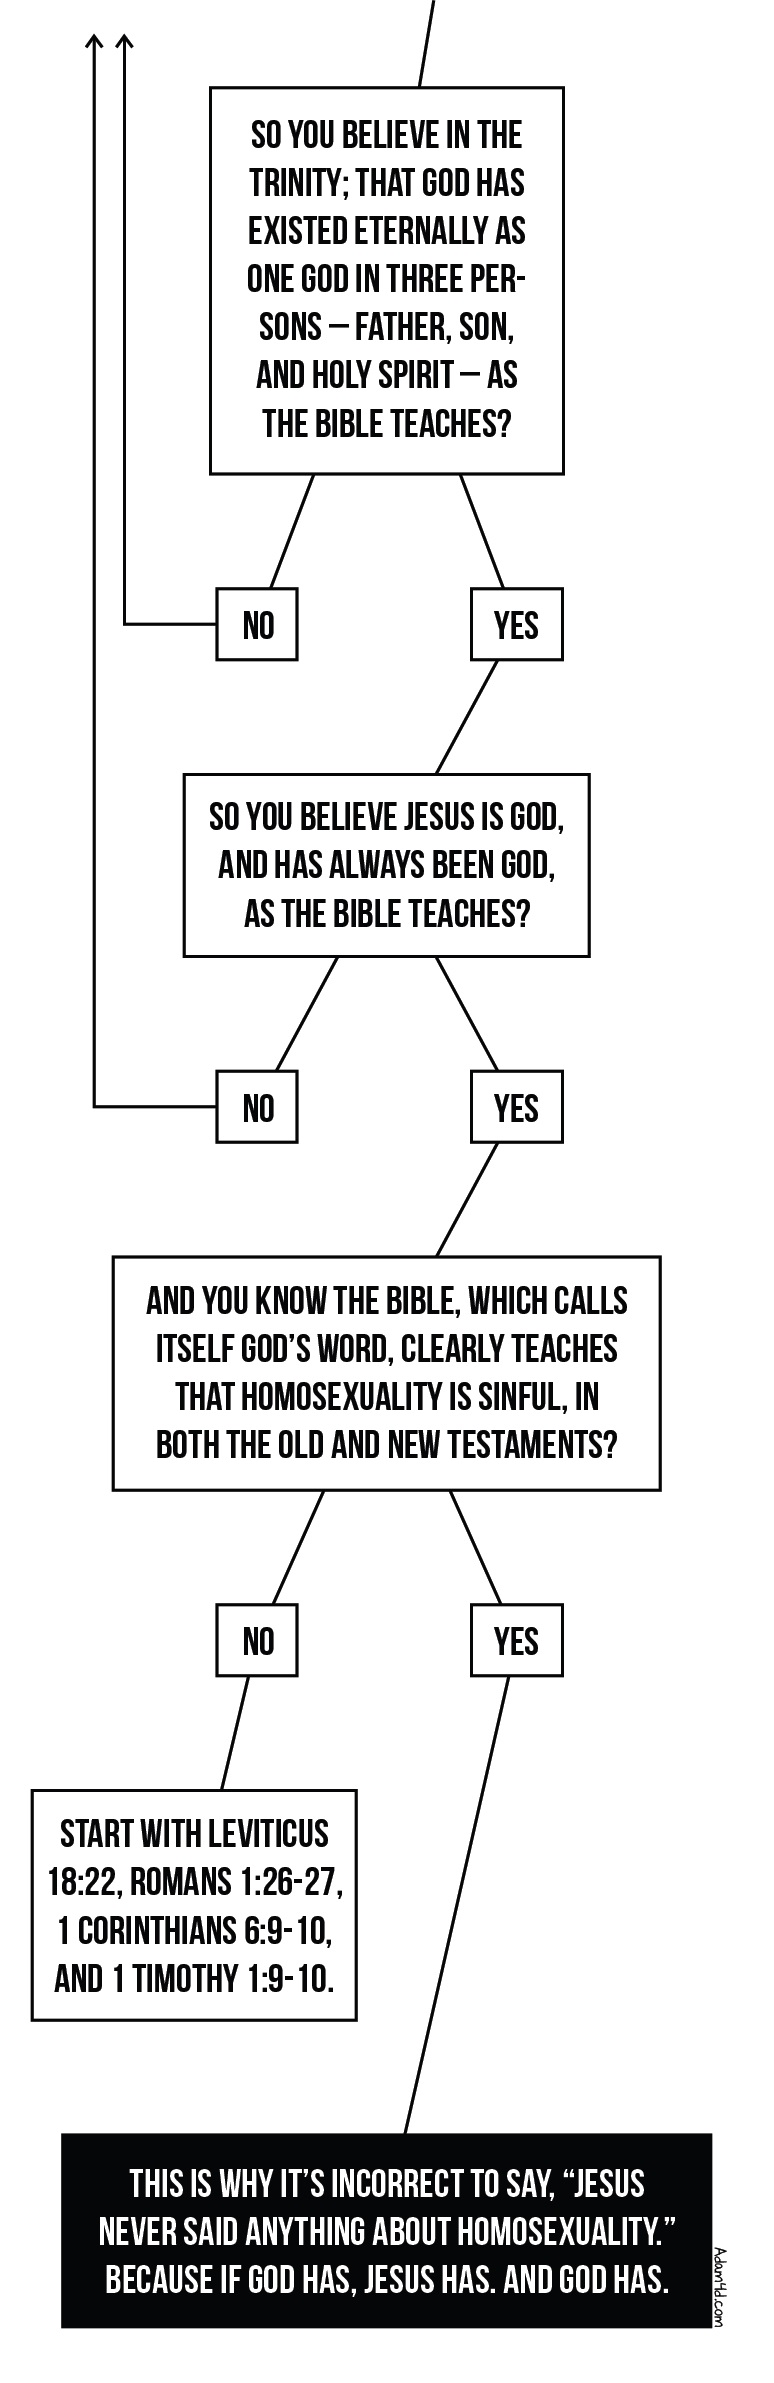
About those Gay Marriage Flow Charts… | Shameless Popery
About those Gay Marriage Flow Charts…
One of those memes that propagates on Facebook...
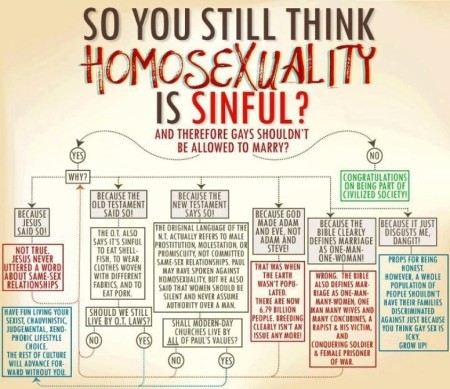
Deconstructed here.
Like every other flowchart I’ve seen on this question, it conflates three things found in the Book of Leviticus: (1) expressions of the moral law (like the Ten Commandments, or the prohibition against homosexuality and other forms of sexual immorality); (2) temporal punishments; and (3) the so-called ceremonial law (like the laws on keeping kosher).
The moral law, as an expression of what is good and evil, is timeless. Good doesn’t suddenly become evil, or vice versa, because it’s Tuesday, instead of Monday, or because it’s 2015 A.D. and not 2015 B.C.
But the particular statutory punishments *weren’t* timeless: they were quite explicitly the law books of the nation of Israel. These laws can be illuminating, in that they show the severity of certain sins, but the Church never considered Israel’s statutory punishments to be binding on Christians. And the ceremonial laws were a way of setting apart the Jewish people to signal them as chosen and to prepare them for Christ.
....
One of those memes that propagates on Facebook...
Deconstructed here.
Like every other flowchart I’ve seen on this question, it conflates three things found in the Book of Leviticus: (1) expressions of the moral law (like the Ten Commandments, or the prohibition against homosexuality and other forms of sexual immorality); (2) temporal punishments; and (3) the so-called ceremonial law (like the laws on keeping kosher).
The moral law, as an expression of what is good and evil, is timeless. Good doesn’t suddenly become evil, or vice versa, because it’s Tuesday, instead of Monday, or because it’s 2015 A.D. and not 2015 B.C.
But the particular statutory punishments *weren’t* timeless: they were quite explicitly the law books of the nation of Israel. These laws can be illuminating, in that they show the severity of certain sins, but the Church never considered Israel’s statutory punishments to be binding on Christians. And the ceremonial laws were a way of setting apart the Jewish people to signal them as chosen and to prepare them for Christ.
....
The idea that Paul doesn’t really condemn homosexual behavior is based on a selective interpretative of two Greek words that he uses in 1 Corinthians 6:9: pornos (πόρνος) and malakos (μαλακός). Pornos means:
- a man who prostitutes his body to another’s lust for hire
- a male prostitute
- a man who indulges in unlawful sexual intercourse, a fornicator
- soft, soft to the touch
- metaph. in a bad sense
- effeminate
- of a catamite
- of a boy kept for homosexual relations with a man
- of a male who submits his body to unnatural lewdness
- of a male prostitute
So the Greek terms used in Paul’s day weren’t specific to only adult male-male sexual behavior (since a great deal of it was man-boy), but they certainly included those behaviors. But besides this, Paul and several other parts of the New (and Old) Testament condemn fornication. That’s broader still, but it shows that non-marital sex is sinful… regardless of who the parties are. (This raises the question: what sort of sexual unions are marriage-material? And we’ll get to that shortly).
....
But there’s a second problem with this claim. It assumes that the Bible is essentially a rule book full of Thou Shalt Not’s. But it’s missing that both Jesus and St. Paul present a positive view of marriage. That is, Scripture shows us what marriage is, which is why we can also say what itisn’t.
This is important, because as we saw from the attempts to work around St. Paul’s prohibitions, the same-sex marriage side is essentially arguing: “but here’s an arrangement nobody had thought of back then!” With a positive view of what marriage is, we can easily establish whether some new sexual variation is compatible with marriage or not.
Subscribe to:
Posts (Atom)